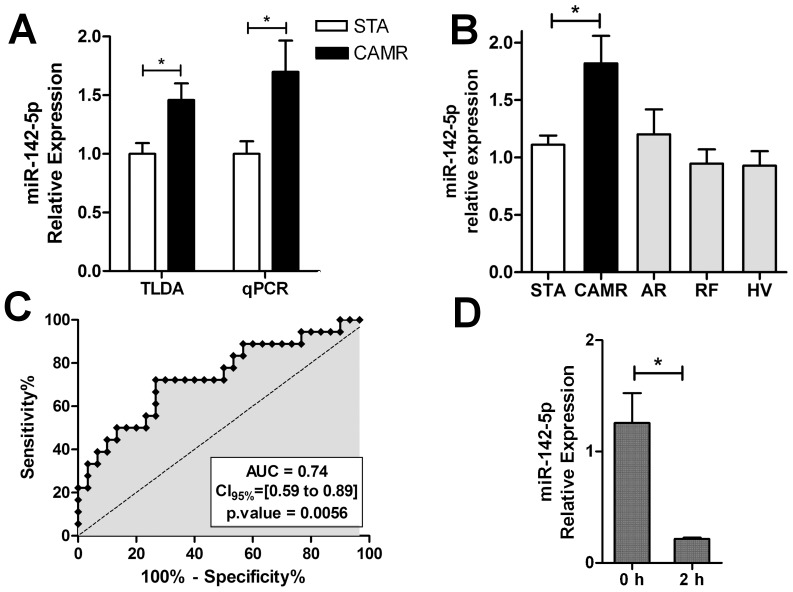
Figure 2. miR-142-5p as a blood biomarker of CAMR.
A) TLDA and individual qPCR measurements performed in same PBMC samples (10 STA and 9 CAMR) are displayed for miR-142-5p. B) miR-142-5p over-expression in CAMR compared to STA only was validated on additional PBMC samples (30 STA and 18 CAMR; p = 0.0058). The expression of miR-142-5p was measured in the blood of patients with different clinical statuses (9AR, 10RF and 8HV). Non parametric Dunn's ad hoc test was used to compare all groups to STA. C) ROC curve analysis of qPCR data for these validation samples (30 STA and 18 CAMR) revealed an area under the curve (AUC) of 0.74 (CI95% = [0.59 to 0.89]; p = 0.0056). D) miR-142-5p expression was rapidly decreased in the PBMC of 3 HV after PHA (2 µg/mL) and Il-2 (150 U/mL) stimulation. Mean ±SEM miR-142-5p expression relative to miR-374b is represented.

