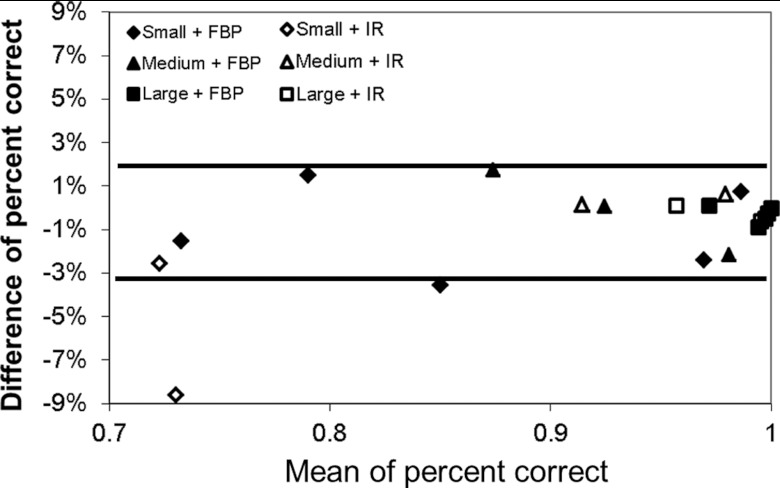
Figure 10.
Bland-Altman plot of percent correct difference between human and model observers in all 21 2AFC tasks. The two solid lines (−3.2% and 2.2%) indicate the average difference ±2σ, where σ is the standard deviation of the differences. For the six points with IR, the average difference ±2 σ is [−8.8%, 5.2%]. If excluding the only point with a big difference of −8.6% (120 mAs and small lesion), the average difference ±2 σ is [−3.0%, 2.1%], similar to FBP.

