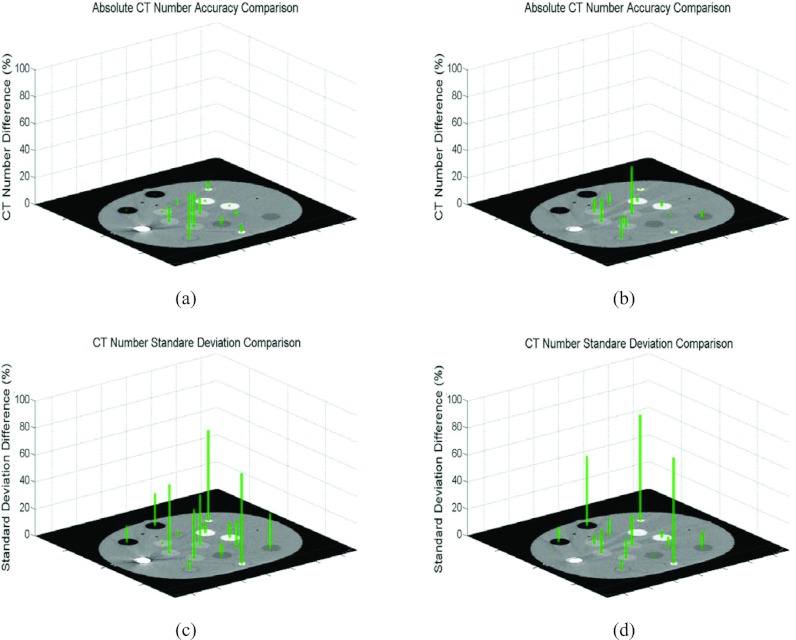
Figure 3.
Comparisons of CT Hounsfield number and noise differences between either the uncorrected unilateral metal implant contaminated images or the O-MAR corrected images and the ground truth data. CT Hounsfield number differences compared to the ground truth: (a) Before O-MAR correction and (b) After O-MAR correction. Noise (standard deviation) differences compared to ground truth: (c) Before O-MAR correction and (d) After O-MAR correction.

