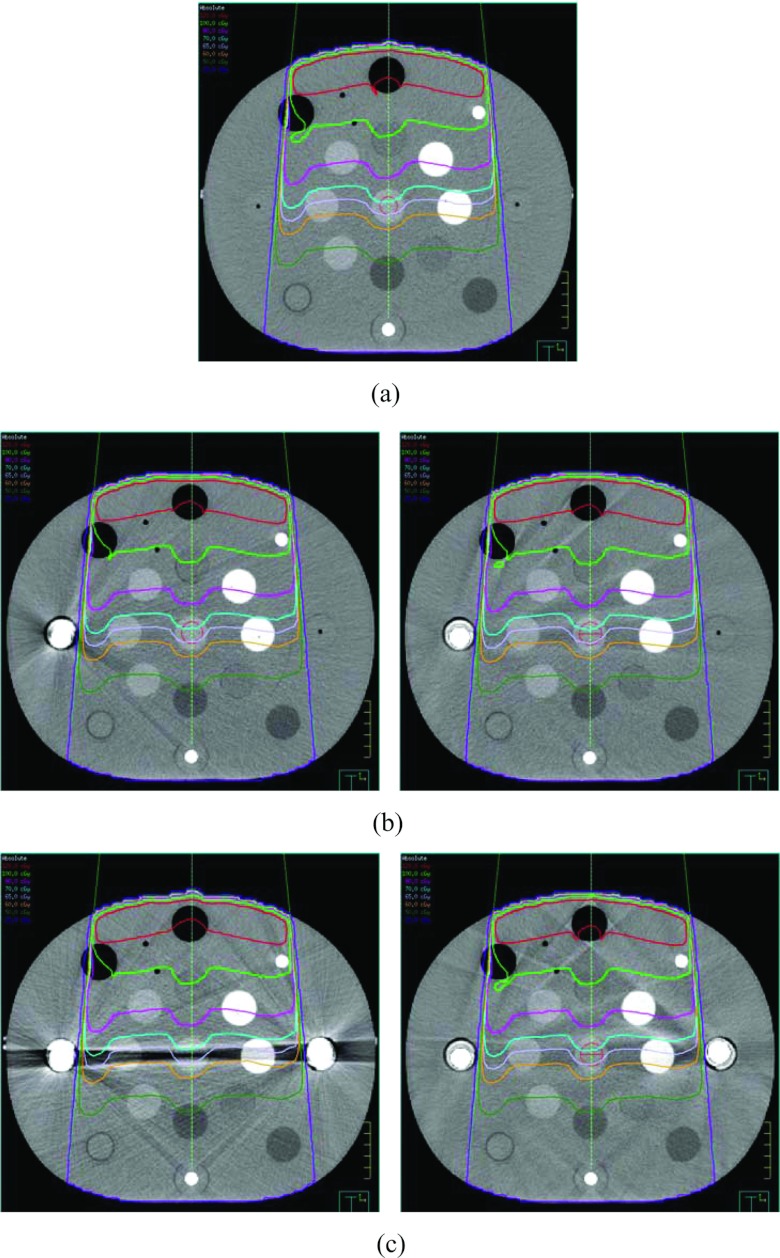
Figure 4.
Comparisons of dose distributions for a single 6 MV 10 × 10 cm2 field calculated on (a) the ground truth image, (b) the image with single hip implant and the O-MAR corrected image, and (c) the image with bilateral hip implant and the O-MAR corrected image. The prescription dose is 100 MU. The image display window width is 400 HU, and window level is 800 HU.

