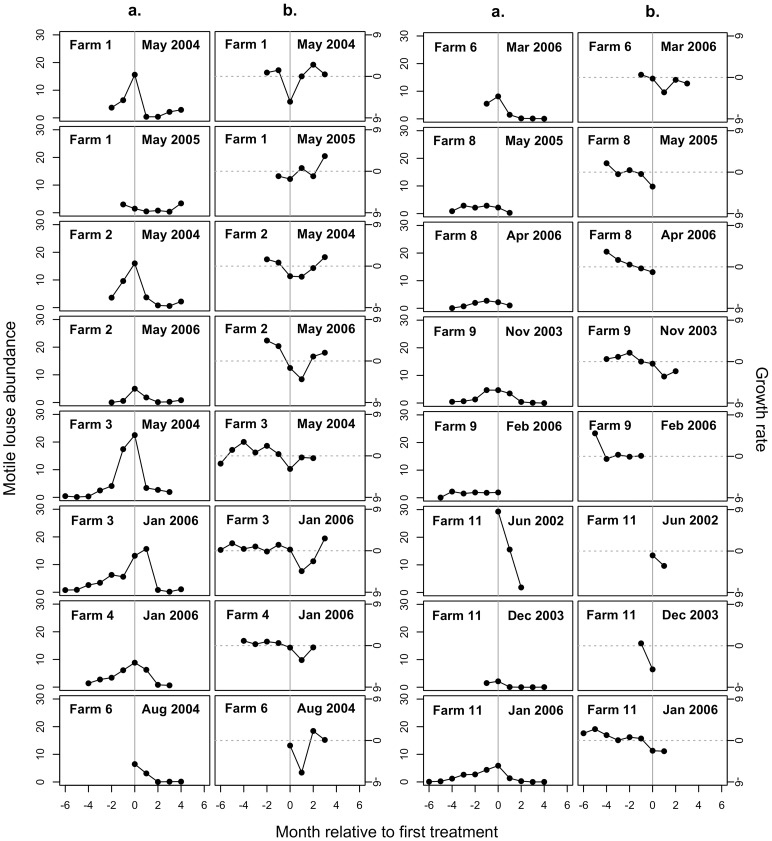
Figure 2. Examples of motile sea louse population dynamics on farms before and after treatment.
Sea louse dynamics for 16 farmed salmon cohorts are shown as a. average motile louse abundance per farmed salmon, and b. growth rate of average motile sea louse abundance per farmed salmon, r = ln[Nt +1/Nt], where Nt is average sea louse abundance per farmed salmon in month t. SLICE® treatment (grey line) was initiated in the month and year specified. Values for the growth rate (rt) are omitted whenever rt is undefined (i.e. when Nt = 0 or Nt + 1 = 0) or missing. Cohorts shown are those with abundance and growth rate data in months immediately preceding or following the first treatment by SLICE® in the pre-treatment or post-treatment data.

