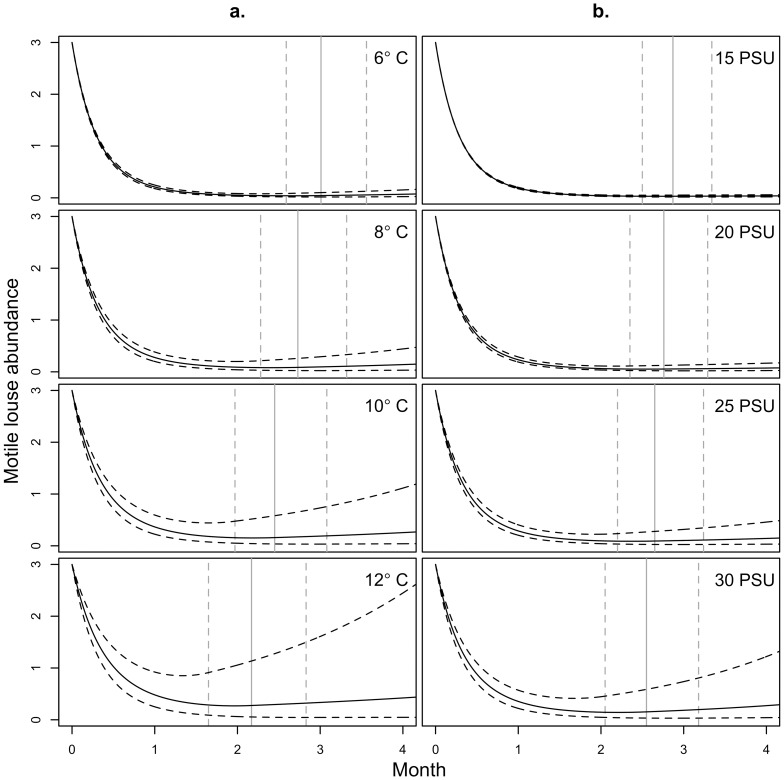
Figure 5. Simulated decline and recovery of sea louse populations at constant temperature and salinity following SLICE® treatment.
Simulations are shown for a. salinity held constant at 26.9 PSU and b. temperature held constant at 8.8°C, the average salinity and temperature recorded for the Broughton Archipelago during the study period (Table 3). To generate the simulations, post-treatment estimates for r, b, c, and d (Table 2) were used until the effective rate of growth r post+b post Tt+c post St+dMt became equal to the pre-treatment (maximum) rate of growth r pre+b pre Tt+c pre St (Table 2). From this point on the pre-treatment parameters were used, and the effect for the number of months since treatment was omitted. Cohort surface area was set to its standardized mean (A = 0) for each simulation. Curved dashed lines correspond to simulations with parameters set one standard error on either side of the mean parameter estimates. Vertical grey lines correspond to the time of transition from post-treatment to pre-treatment parameters (i.e. t such that r post+b post Tt+c post St+dMt = r pre+b pre Tt+c pre St) for the mean (solid) and one-standard-error-removed (dashed) simulations.

