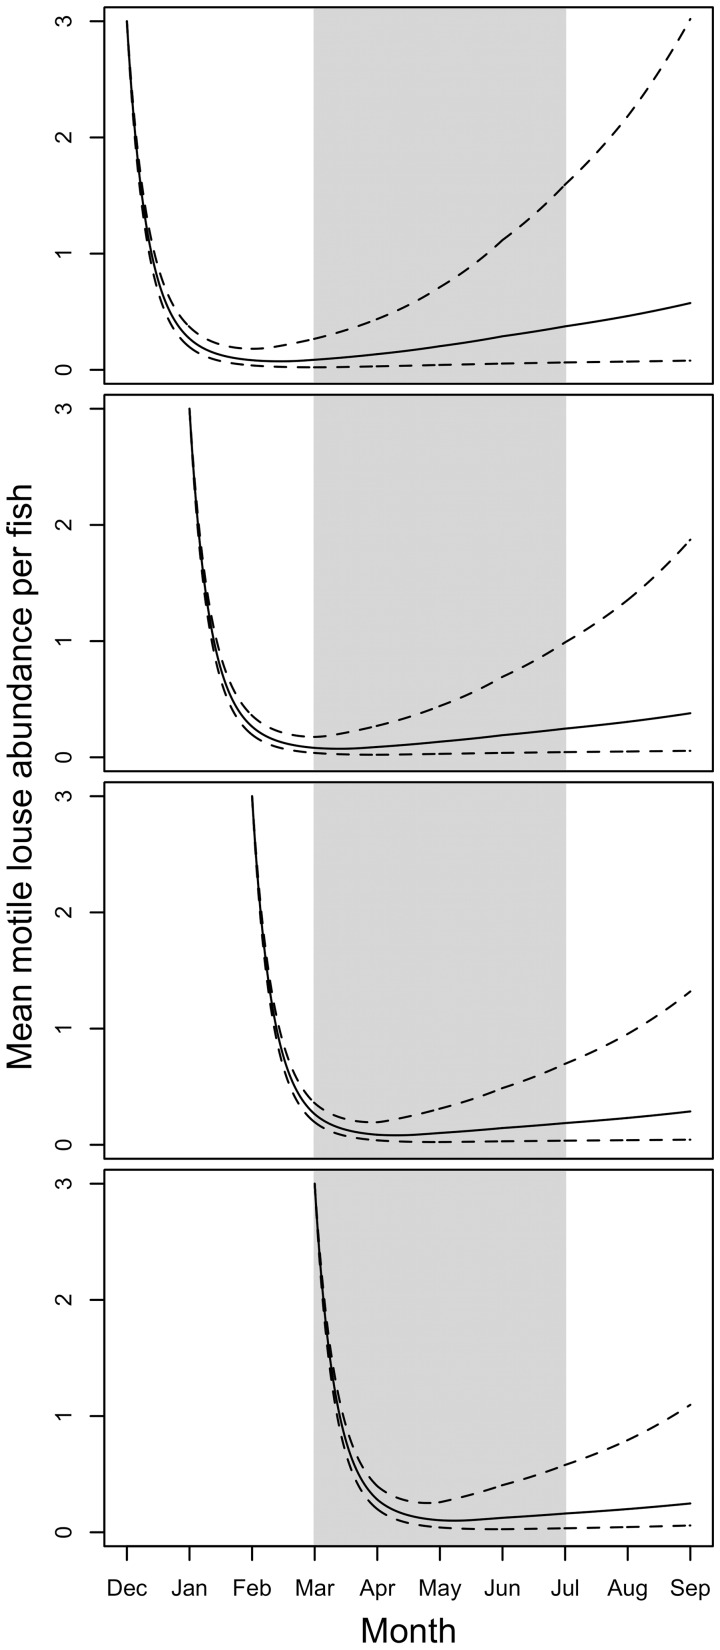
Figure 6. Simulated decline and recovery of sea louse populations at varying temperature and salinity following SLICE® treatment.
Simulations correspond to SLICE® treatment initiated in December, January, February, and March in advance of the March–June juvenile wild salmon migration (grey shaded region). Simulations used a combination of post-treatment and pre-treatment parameter estimates as described for Figure 5. Temperature and salinity were varied by month to represent the average monthly conditions across salmon farms during December–September in the Broughton Archipelago. Dashed lines correspond to simulations with parameters set to one standard error on either side of the mean parameter estimates.

