Figure 2.

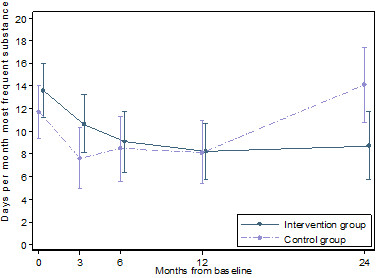
Estimated days per month of substance use the last 3 months. With 95% confidence intervals (vertical lines) as a function of months from baseline. Estimates based on a linear mixed model.

Estimated days per month of substance use the last 3 months. With 95% confidence intervals (vertical lines) as a function of months from baseline. Estimates based on a linear mixed model.