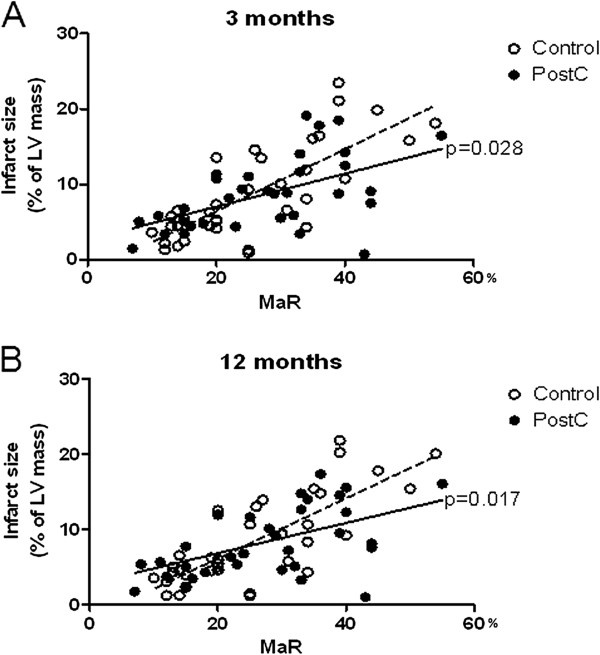
Figure 3.

Infarct size (expressed in relation to left ventricular mass) plotted against myocardium at risk (MaR) for the overall study population (n = 68) at (A) three and (B) 12 months in patients belonging to the control and postconditioning (PostC) groups. Significant differences between the slopes of the regression lines of the two groups are indicated.
