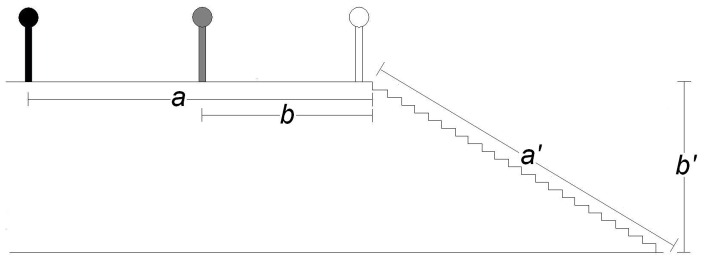
Figure 1. Participant position during Experiments 2–4.

The black icon represents participant position while estimating horizontal long (a, 7.11 m), the gray while estimating horizontal short (b, 3.56 m) and the white while estimating stair length (a’, 7.11 m) and stair height (b’, 3.56 m).
