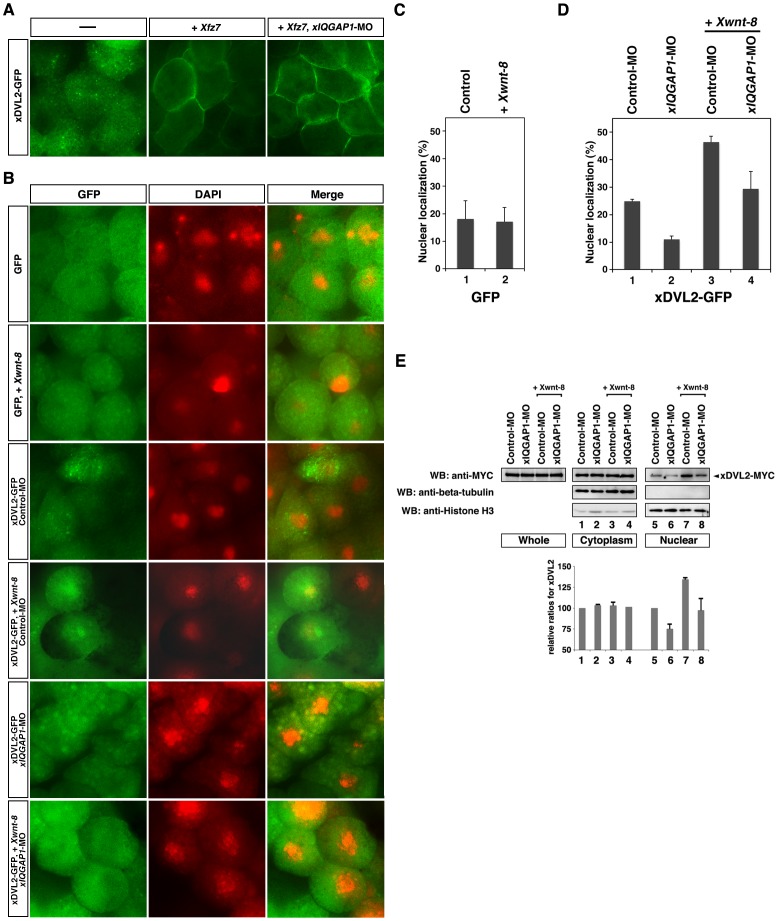
Figure 2. Localization of xDVL2-GFP.
(a,b) Localization of xDVL2-GFP in Xenopus animal cap cells at stage 10. (A) xDvl2-GFP localized in punctate structures in the cytoplasm (left). Over-expression of Xfz7 recruited xDVL2-GFP to the plasma membrane (center). xIQGAP1-MO did not affect the membrane localization of xDVL2-GFP induced by Xfz7 (right). (B) Nuclear localization of GFP and xDVL2-GFP caused by over-expression of Xwnt-8 and xIQGAP1-MO. GFP signals (left). DAPI staining of animal cap cells (center). Merge (right). (C, D) The ratio of cells that had nuclear fluorescence signals. The average of ratio was taken with six explants in 3 independent experiments (See Materials and Methods). Error bars represent standard deviation of the mean with six explants. Statistical significance was determined by Student's t-test. (C) The ratio of GFP localized in the nucleus in cells. Xwnt-8 was co-injected in lanes 2. Lane 1: n = 291, 18.2%, lane 2: n = 320, 17.2%. P>0.1 [between lane 1 and lane 2]. (D) The ratio of xDVL2-GFP localized in the nucleus in cells injected with xIQGAP1-MO. Xwnt-8 was co-injected in lanes 3 and 4. Lane 1: n = 918, 26.0%, lane 2: n = 1694, 11.0%, lane 3: n = 263, 46.4%, lane 4: n = 477, 29.4%. P<0.01 [between lane 1 and lane 2], P<0.01 [between lane 3 and lane 4]. (E) Cytoplasmic and nuclear distribution of xDVL2, xIQGAP1 and ß-catenin in animal cap cells. MYC-tagged xDVL2 mRNA (100 pg) was injected into the animal poles of 4-cell stage embryos, and the injected animal caps were dissected at stage 10. Lysates from the animal caps were fractionated and subjected to Western blotting with indicated antibodies. Each relative intensity was measured by ImageJ, and its relative ratio was calculated against Input with beta-tubulin for cytoplasm or with Histone H3 for nuclear. Error bars represent standard deviation of the mean in three experiments. Statistical significance was determined by Student's t-test. P<0.1 [between lane 5 and lane 6], P<0.1 [between lane 7 and lane 8].

