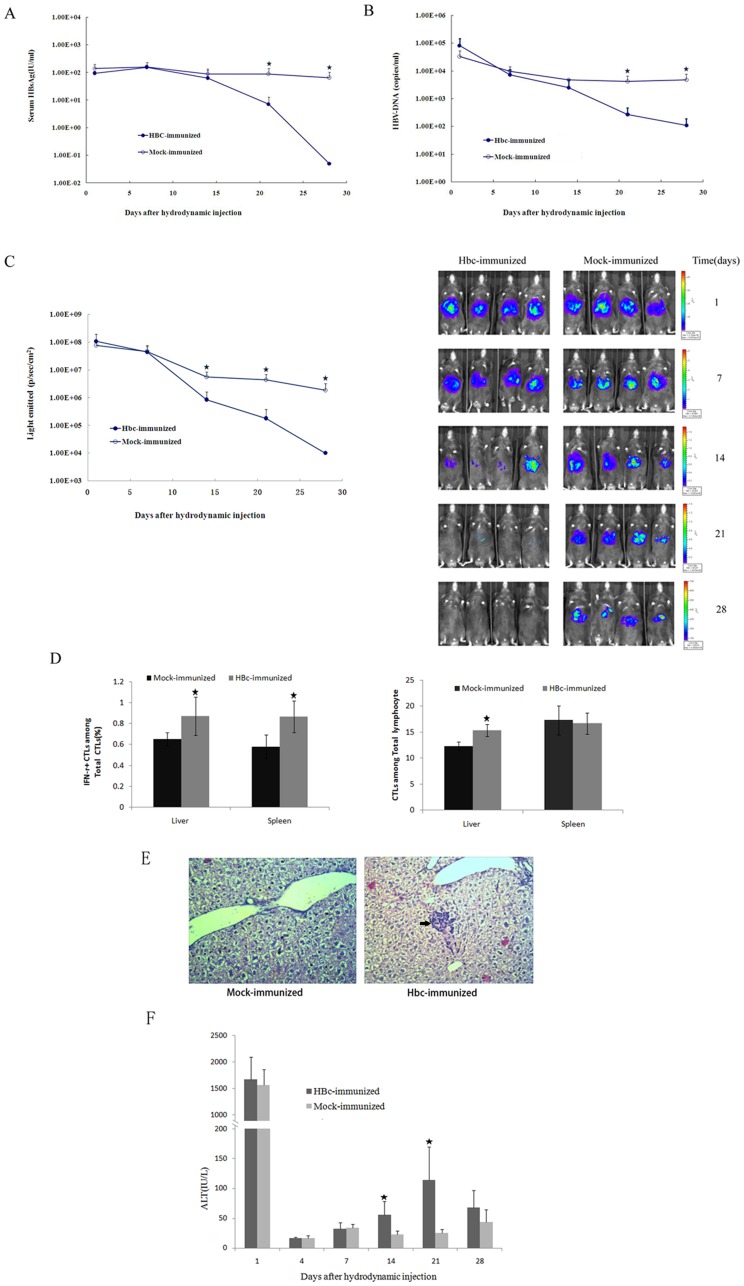
Figure 2. Monitoring anti-HBV CD8+ T cell function in the liver by bioluminescence imaging after immunization.
A. Titers of serum HBsAg in HBcAg- or mock-immunized C57BL/6 mice after hydrodynamic injection of pGL3/Fluc-HBV1.2. B. Serum HBV DNA in the HBcAg- or mock-immunized C57BL/6 mice after hydrodynamic injection. The detection limit for HBV DNA in our system was 100 copies/ml. C. Real-time in vivo imaging of Fluc expression in the HBcAg- or mock-immunized C57BL/6 mice over a period of 28 days after hydrodynamic injection. D. Liver- and spleen-associated CTLs were stimulated ex vivo with HBV peptides for 5 hours. Left: percentages of interferon-γ–secreting CTLs on day 21 postinfection (n = 4). Right: percentages of CTLs on day 21 postinfection (n = 4). Statistical differences are indicated as follows: * = p<0.05. E. Hematoxylin/eosin staining of liver sections from mice treated as in (D). Arrowheads indicate lymphocytic infiltration (magnification, 200x). F. Serum alanine aminotransaminase activity in the HBcAg- or mock-immunized C57BL/6 mice after hydrodynamic injection.

