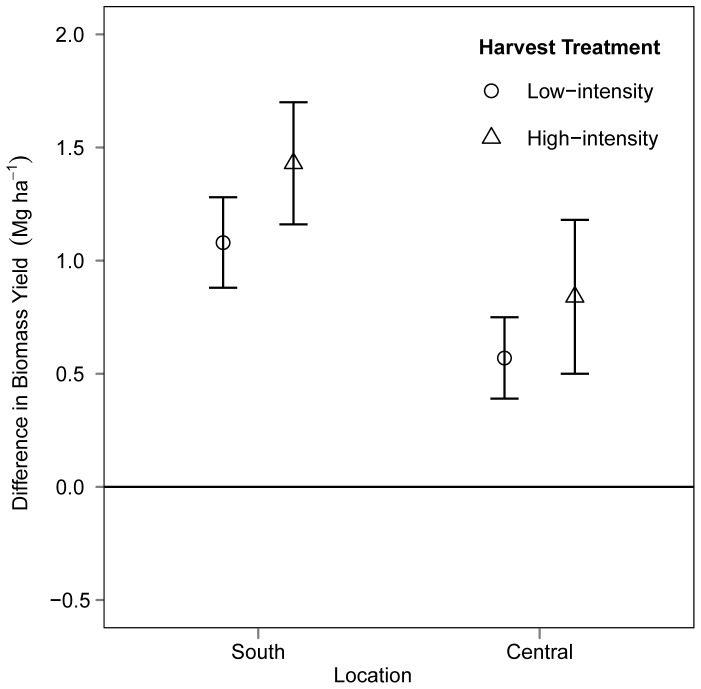
Figure 3. Change in biomass yield from 2009 to 2011 in low- and high-intensity harvest treatments by location.
Average change in biomass yield(±90% CI). In low-intensity plots, one third to one half of the annually harvested biomass was from an area not previously harvested. High-intensity harvest plots included biomass from the same area harvested annually.

