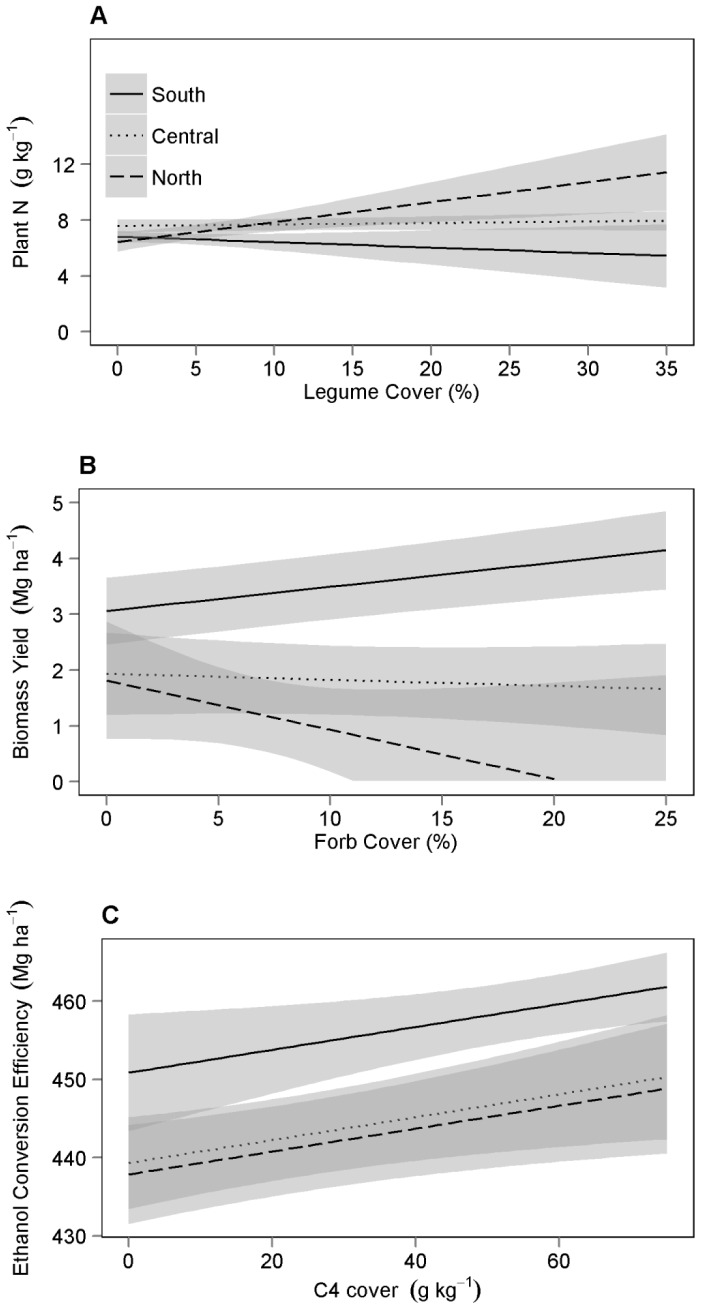
Figure 5. Estimated effect of plant functional group composition on bioenergy potential.
Regression line estimates(±90% CI) of the effect of legume cover on the concentration of N in biomass after harvest (A), the effect of forb cover on biomass yield (B), and the effect of C4 cover on ethanol conversion efficiency (C). Estimates are from the best fitting models with all other covariates held constant at their average values.

