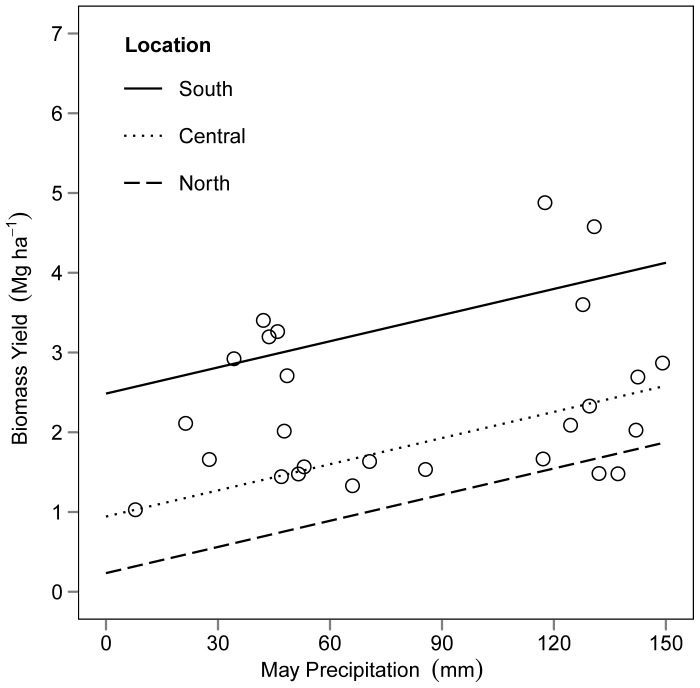
Figure 6. Estimated effect of May precipitation on biomass yield.
Dots represent average measured biomass yield and May precipitation values by block. Regression lines are model estimates for bioenergy yield across the precipitation gradient for each location, with all other covariates held constant at their average values.

