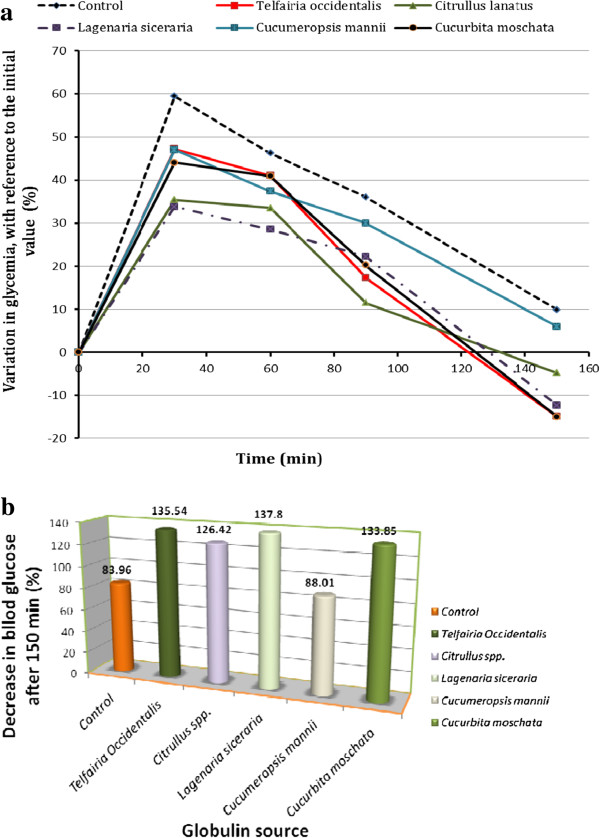
Figure 4.
Changes in glycaemia in different experimental groups during treatment. a: Variation of glycaemia in different groups during the treatment. The decrease was determined in % with reference to the initial value before glucose ingestion. b: Decrease in glycaemia at 150 min, following hyperglycaemia induction in rats treated with globulins from different Cucurbitaceae species. The decrease was determined in % with reference to the value obtained at 30 min following glucose ingestion.

