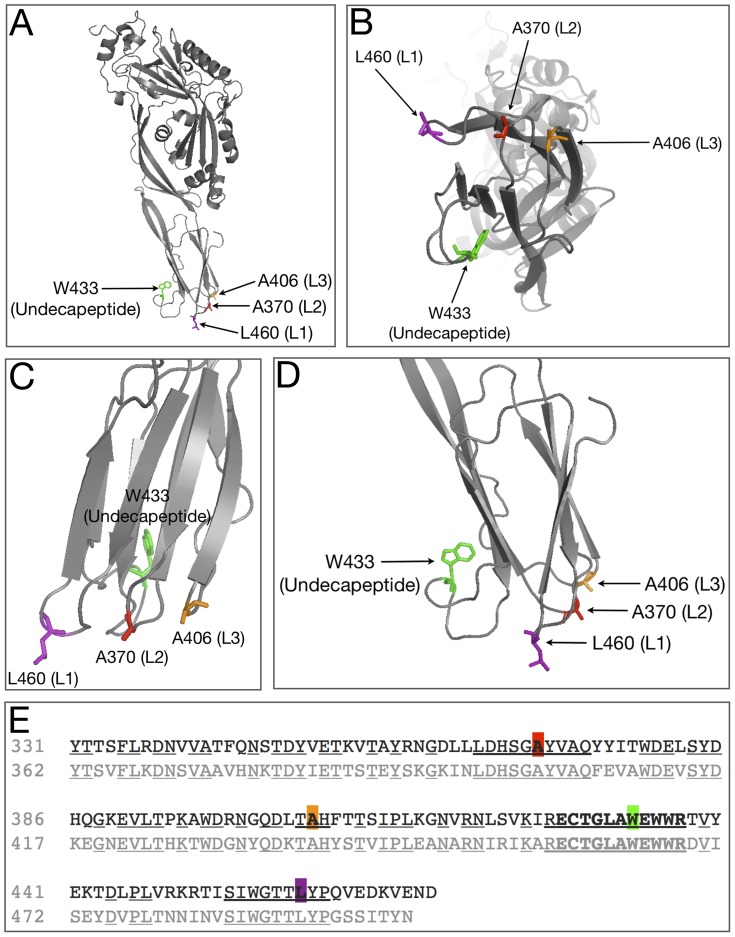
Figure 1. Ply Structure and Sequence Alignment.
A) Ribbon diagram of Ply with the domain 4 loop residues shown at the base. B) The bottom view of domain 4 showing the relative placement of each loop. C) Zoomed in view of domain 4 and D) is a 90° rotation of domain 4. E) Sequence alignment between Ply (top line) and Pfo (bottom line), centered at the undecapeptide sequence (bold). Areas of homology between the two sequences are shown as underlined. Mutagenesis targets are shown as colored blocks.

