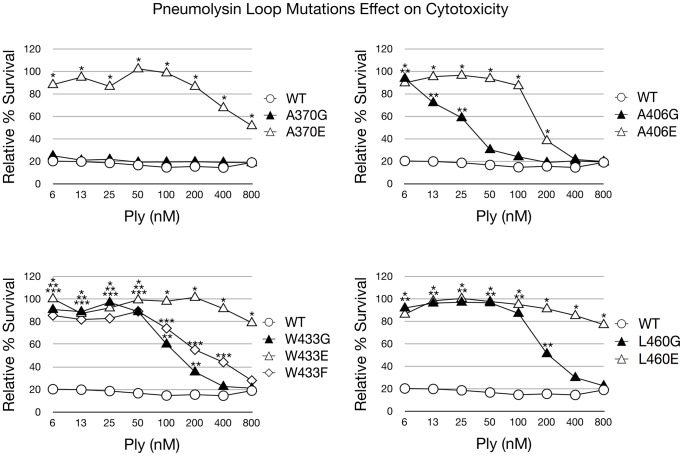
Figure 3. Ply Cytotoxicity on HCECs.
Ply cytotoxicity on HCECs was measured by staining with calcein AM, a selective marker for healthy cells with intact membranes. Percent survival was normalized using PBS (negative) and TX100 (positive) treated cells as controls. The results are shown as % survival. Each mutant was statistically compared to PlyWT and significant differences (P<0.05) are denoted as a single asterisk (open triangles), 2 asterisks (closed triangles), or 3 asterisks (open diamond) to account for each represented mutant. Error bars are not pictured to prevent obstruction of the data points for viewing.

