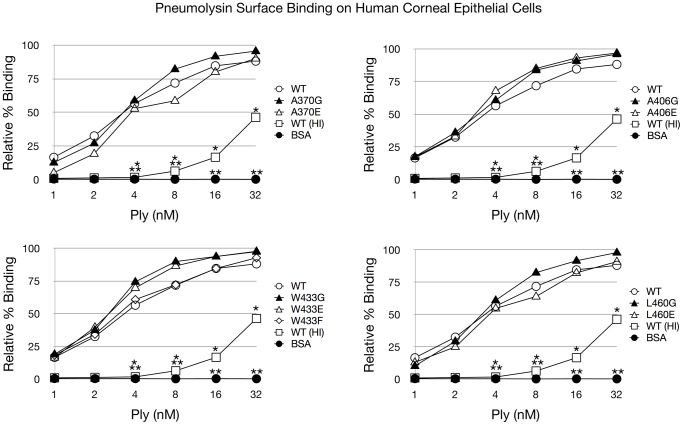
Figure 4. Ply Surface Binding to HCECs.
Flow cytometry was used to assess surface binding to HCECs. Various concentrations of AF488 labeled Ply were incubated in the presence of 3x10⁵ fixed HCECs. AF488 labeled bovine serum albumin (BSA) and AF488 labeled heat inactivated (HI) PlyWT were included as controls. Data is presented as % of cells with Ply surface binding compared to total cells. Each mutant was statistically compared to PlyWT and significant differences (P<0.05) are denoted as either a single asterisk (open squares) or 2 asterisks (closed circles) to account for each group. Error bars are not pictured to prevent obstruction of the data points for viewing.

