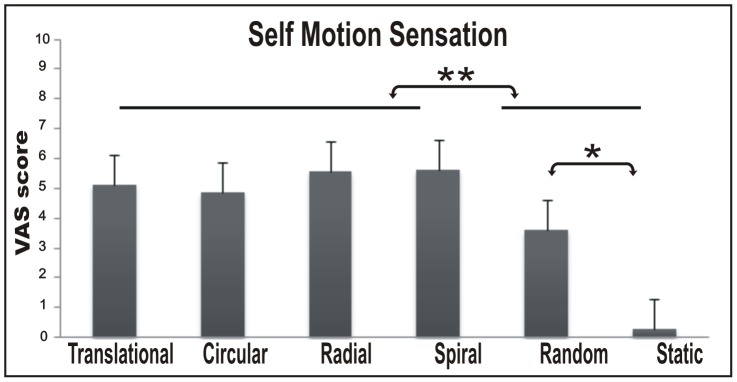
Figure 2. Psycophysical results.

Histograms show the Intensity of self motion sensation revealed by VAS scale across subjects. Bars represent the mean VAS scores ± standard error of the mean across runs and participants.

Histograms show the Intensity of self motion sensation revealed by VAS scale across subjects. Bars represent the mean VAS scores ± standard error of the mean across runs and participants.