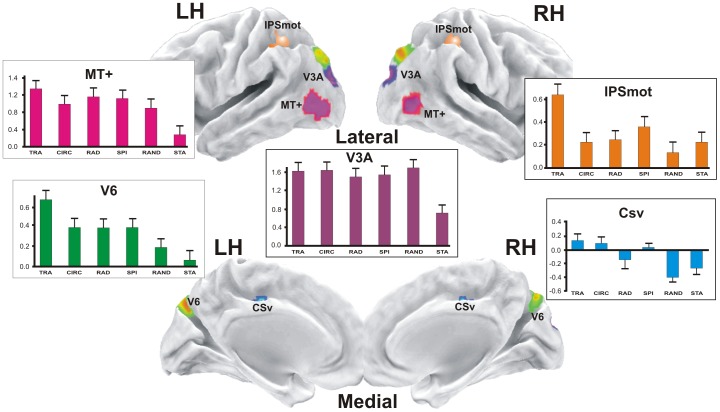
Figure 3. Motion areas.
In color are the regions more activated in at least one of the motion (M) conditions relative to the static (S) condition (contrast M-S): V6; MT+, middle temporal complex; V3A; CSv, visual cingulate sulcus area; IPSmot, Intra Parietal Sulcus motion area. The plots represent the averaged BOLD percent signal change ± standard error of the mean across subjects and hemispheres for each experimental condition labelled as follows: TRA, translational; CIR, circular; RAD, radial; SPI, spiral; RAND, random; STA, static.

