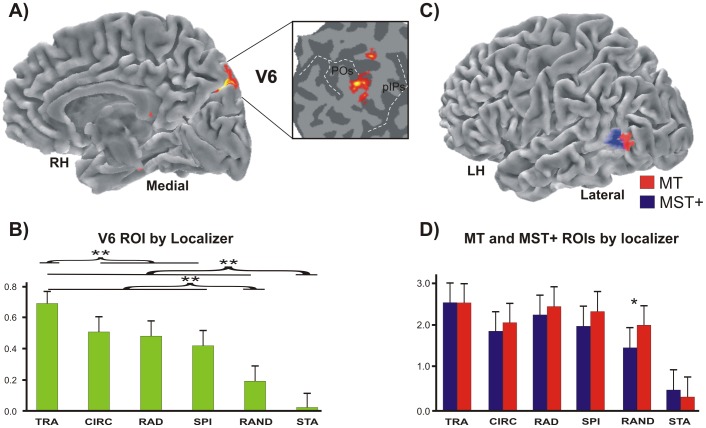
Figure 4. Motion areas mapped by localizers.
(A) Area V6 mapped with the functional localizer, i.e., coherent flow versus randomly moving dots. Results are displayed on the medial folded representation of the right hemisphere of the template brain. The anatomical location of V6 can be better appreciated in the close-up of the flattened surface (white box) taken from the same average brain. Dashed lines, fundus of the main sulci; POs, parieto-occipital sulcus; pIPs, posterior end of the intraparietal sulcus. (B) Plots represent the averaged BOLD percent signal changes ± standard error of the mean in the localizer-defined area V6. (C) Imaging results from the functional localizer used to map areas MT and MST+ (i.e., ipsilateral vs contralateral radial motion). Results are displayed on the lateral folded representation of the left hemisphere of the template brain. (D) Plots represent the averaged BOLD percent signal changes ± standard error of the mean in the localizer-defined areas MT and MST+.

