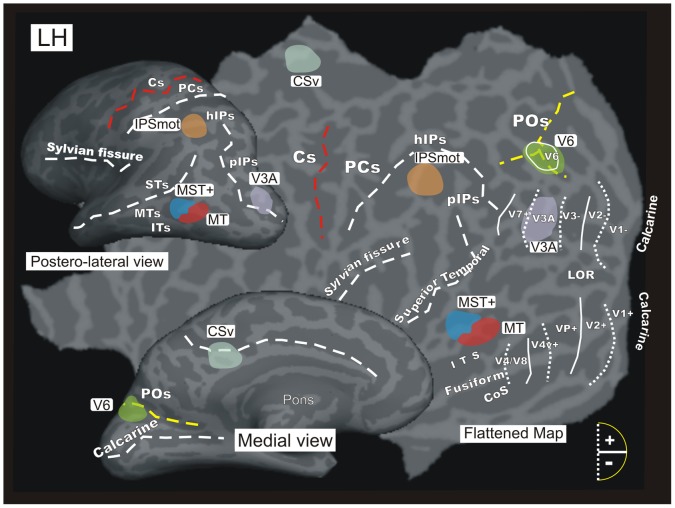
Figure 5. Motion and other visual areas of the brain.
An inflated (medial and dorso-lateral views) and flattened representation of the left hemisphere of a representative participant marked with the locations of the six average regions of interest (ROIs) that were studied: V6, MT, MST+, V3A, CSv and IPSmot. The six ROIs are displayed together with the borders of the visual areas identified in this subject by retinotopic mapping. Area V6 as defined by the retinotopic mapping is indicated by white outline and label on the POs, which overlaps with the V6 ROI in green. The dashed lines reported on both the flat map and the inflated representations indicate the fundus of the major sulci. Dotted and continuos lines indicate the vertical and horizontal meridian representations in visual areas, respectively. Major sulci (dark gray) are labeled as follows: ITs, Inferior Temporal sulcus; MTs, Middle Temporal sulcus; STs, Superior Temporal sulcus; hIPs, horizontal segment of the intraparietal sulcus; PCs, post-central sulcus; Cs, Central sulcus; LOR, Lateral Occipital Region; COs, Collateral sulcus. Other labels are as in Figure 4.

