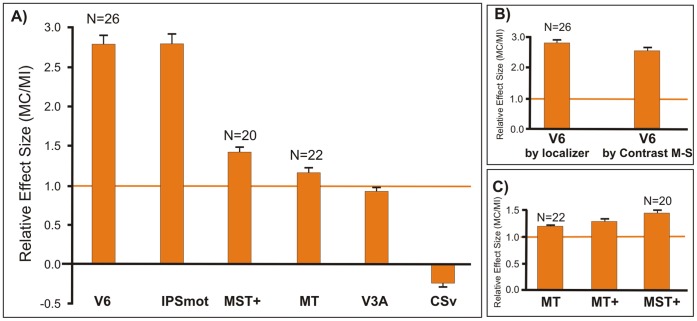
Figure 6. Cortical responses to motion coherency.
Average motion coherence coefficients extracted from the functionally defined ROIs (see Materials and Methods). (A) MC/MI coefficient in areas CSv, V3A, and IPSmot, as defined by the group statistical contrast (M-S) and in areas V6, MT and MST+, as defined by functional localizer. (B) MC/MI coefficient in area V6, as defined by the group statistical contrast (M-S) and by functional localizer. (C) MC/MI coefficient in area MT+, as defined by the statistical contrast (M-S) and in its functional subdivisions MT and MST+, as defined by functional localizer. The MC/MI coefficient of 1 is marked by a thicker orange horizontal line to indicate identical response to both kinds of motion. Bars represent the mean coefficients ± standard error of the mean across runs and participants (n indicates number of hemispheres).

