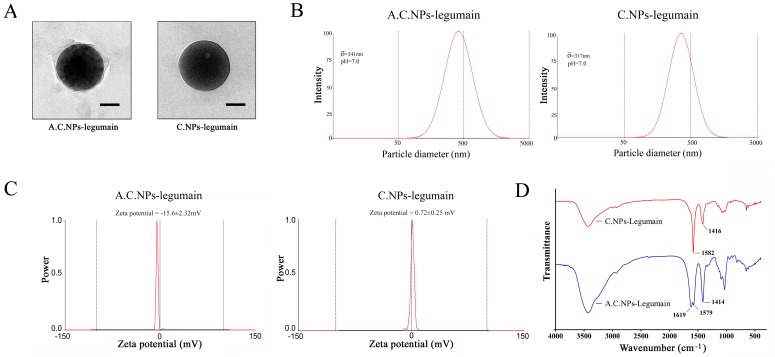
Figure 2. Characteristics of A.C.NPs-legumain and C.NPs-legumain.
(A)Representative images of A.C.NPs- legumain (left) and C.NPs-legumain (right) observed by TEM. Scale bar = 100 nm. (B& C) Size distributions in purified water (pH7.0) and the mean value of zeta-potentials of A.C.NPs-legumain and C.NPs-legumain at 37°C. (D) FTIR spectra of uncoated chitosan particles and alginate acid-coated chitosan particles.

