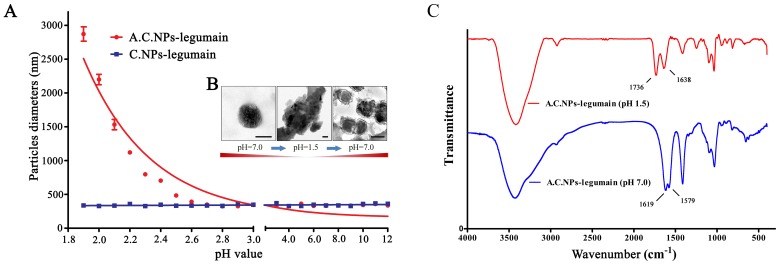
Figure 3. Characteristics of C.NPs-legumain and A.C.NPs- legumain in an acidic environment.
(A) Nanoparticles were treated in different acidity levels (pH 1.8∼12) for 2 hours. C.NPs-legumain and A.C.NPs-legumain particle diameter and zeta potential measurements at 37°C. (B) Representative images of A.C.NPs at pH 1.5 (left, scale bar = 1µm) and pH 7.0 (right, scale bar = 100 nm). (C) FTIR spectra of A.C.NPs-legumain at pH 1.5 and pH 7.0.

