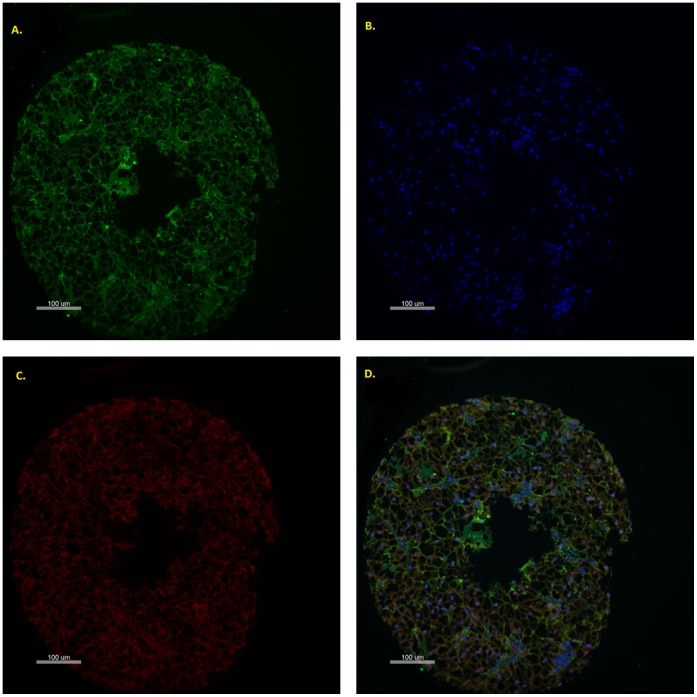
Figure 1. AQUA Images of renal cell carcinoma.
Representative TMA core showing green cytoplasmic staining with a combination of cytokeratin and pancadherin (A), blue nuclear staining with DAPI (B), red target staining (C, in this case VEGFR1) and all three compartments combined (D). Quantitative assessment and compartment localisation of target expression is measured through calculating the sum of target pixel intensity divided by the compartment area and normalized for exposure time.

