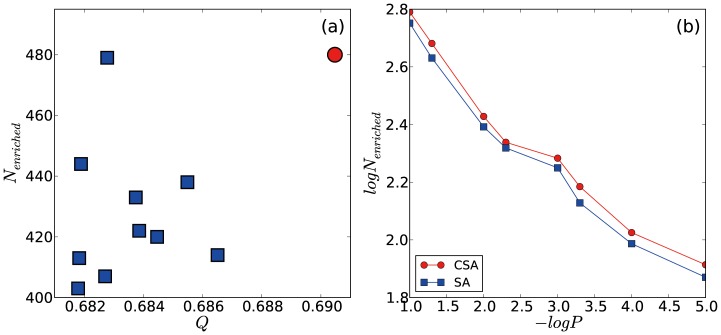
Figure 3. Modularity versus the number of enriched functional clusters, and its dependence on P-value.
(a) Best modularity values obtained by 10 CSA simulations (red circle) and 10 SA simulations (blue squares) against the number of enriched functional clusters with the P-value threshold of 0.05 are shown. It should be noted that 10 best solutions by CSA provide an identical solution implying that it may correspond to the true optimal solution. (b) Log-log plot of P-value threshold and the number of enriched functional clusters are shown. The highest modularity community structure obtained by CSA yields larger numbers of enriched functional clusters than those by SA regardless of the P-value threshold used.

