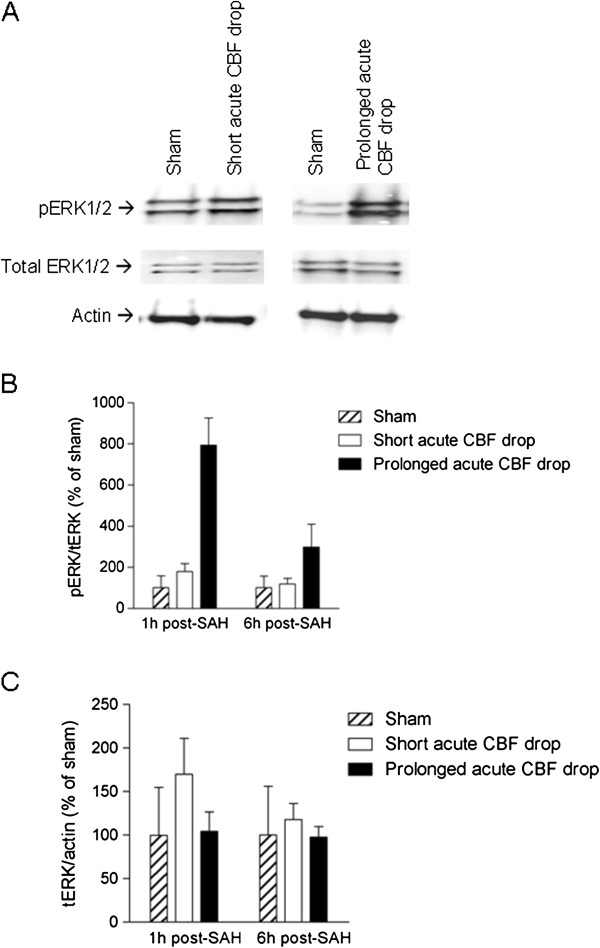
Figure 5.

Duration of acute CBF drop during SAH determines degree of early activation of ERK1/2 in cerebral arteries after SAH. Immunoblots of phospho-ERK1/2, total ERK1/2 and actin levels in cerebral artery tissue from sham-operated rats, SAH rats with short acute CBF drop and SAH rats with prolonged acute CBF drop. (A) Representative immunoblots of cerebral artery tissue from rats terminated 1 h after sham-operation or SAH with short or prolonged acute CBF drop. (B and C) Band chemiluminiscence intensity quantifications presented as means ± s.e.m. of the ratios between phosphorylated ERK1/2 and total ERK1/2 protein bands (B) or ratios between total ERK1/2 and actin protein bands for rats terminated either 1 h or 6 h after SAH or sham-operation. Numbers of rats in the groups are: 1 h Sham n = 5, 1 h SAH short acute CBF drop n = 3, 1 h SAH prolonged acute CBF drop n = 2, 6 h Sham n = 4, 6 h SAH short acute CBF drop n = 2, 6 h SAH prolonged acute CBF drop n = 2.
