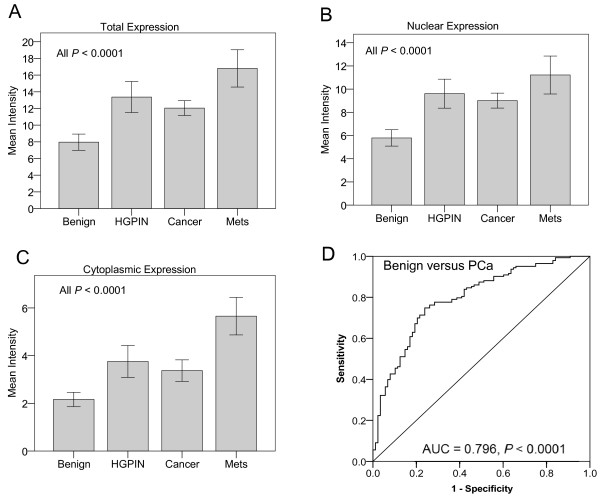
Figure 2.
Quantitative analysis of HP1γ expression in human prostate cancer. VECTRA™ technology was used for automated image attainment and analysis per the manufacturer’s protocol. Both the nuclear and cytoplasmic compartments were compared. Cell intensities were averaged on a per cell basis for each core to determine the mean intensity of nuclear, cytoplasmic and total HP1y expression. Mean intensity of expression of HP1y was then compared for benign, HGPIN, cancer and metastasis core samples with 95% confidence intervals. HP1y expression in HGPIN, cancer (N= 146 cores), and metastasis is significantly greater than benign (N=96 cores) for total (A), nuclear (B), and cytoplasmic (C) expression with P values <0.0001. Nuclear expression of the protein was ~2.5 fold greater than cytoplasmic expression. D) ROC curve analysis was used to determine the optimum cut-off for defining overexpression. Total HP1γ expression demonstrated excellent discrimination between benign and cancer (AUC = 0.796, P < 0.0001). A cut-off of 9.095 maximized the sensitivity (76.2) and specificity (73.5%) and was used to define overexpression.

