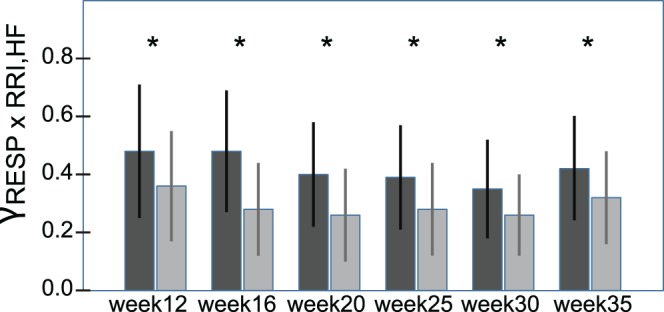
Figure 3. Time course of the phase synchronization index γ of R-R interval and respiration(HF-components; mean ± SD) throughout gestation: Black bars (mean ± SD) depict the values of the variables in rest, grey bars (mean ± SD) show the post stress (deep breathing) condition. (γ = synchronization index; RRI = R-R interval; RESP = respiration; HF = high frequency).

*denotes a significant difference (p<.05) between rest and post DB in case of a significant univariate interaction effect.
