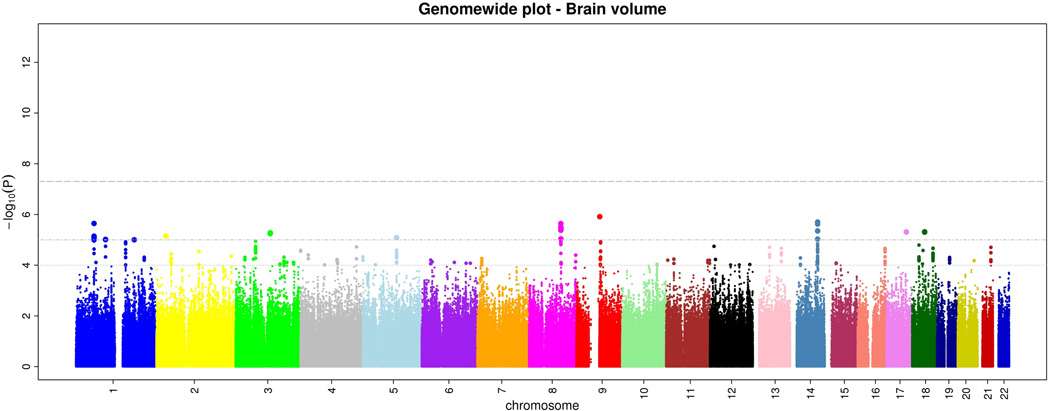
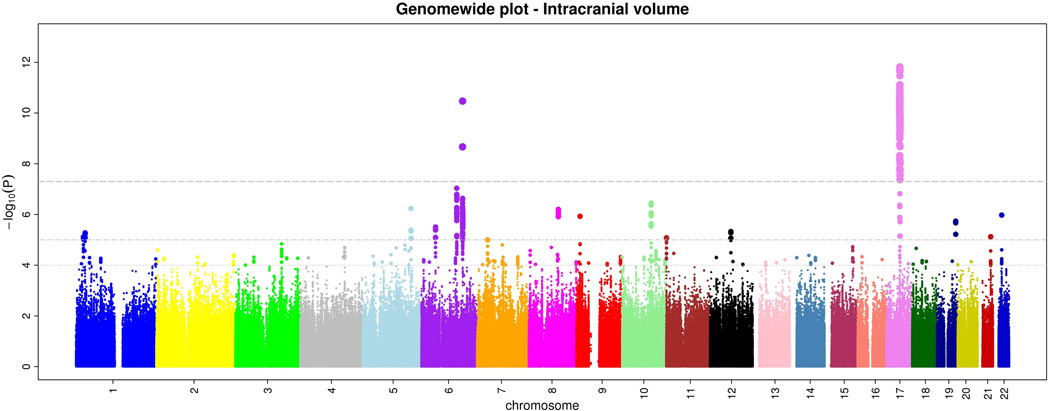
Figure 1.
a and b. Genome-wide signal intensity (Manhattan) plots showing the individual p-values (based on the fixed-effects meta-analysis) against their genomic position for brain volume (a) and intracranial volume (b). Within each chromosome, shown on the x-axis, the results are plotted left to right from the p-terminal end. The horizontal lines indicate thresholds for p=10−4, p=10−5, and p=5*10−8 (genome-wide significant).


