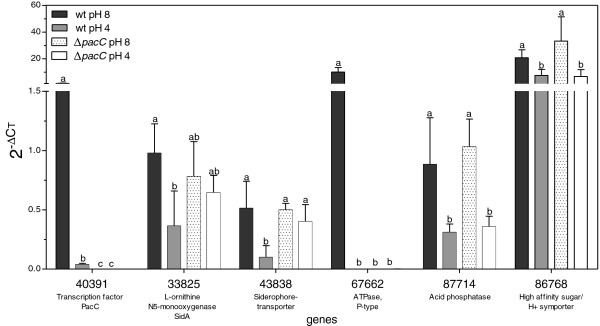
Figure 3.

Expression profiles of six candidate pH-regulated genes. Expression of six of the genes listed in (Table 1) was followed by qPCR. Bars show the mean of 3 experiments; error bars indicate ± SD. Different letters (a, b, c) indicate significant differences between treatments according to ANOVA of the data for each gene (significance: post-ANOVA Tukey’s test, P<0.05).
