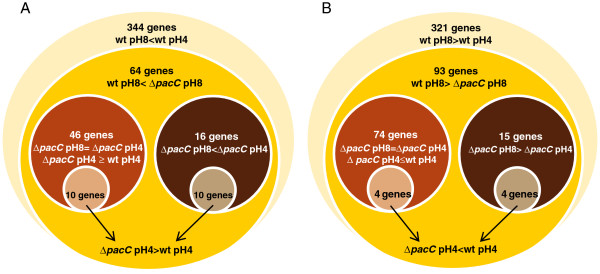
Figure 5.

Venn diagram of classes of significantly regulated genes. The diagram shows subclasses of downregulated (A) and upregulated (B) genes for wild type and ΔpacC, and their overlap. > indicates greater transcript levels in the treatment shown at the left of the symbol; < indicates decreased transcript levels. The lists of genes in each class are given in Additional file 7.
