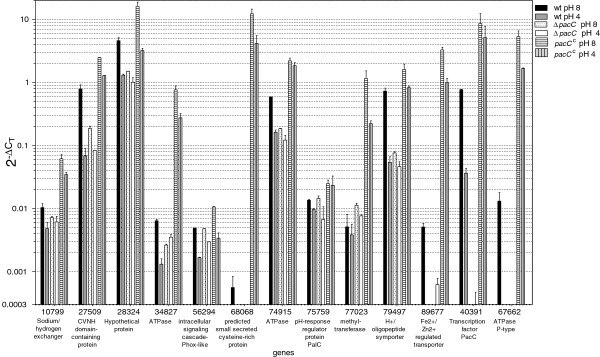
Figure 6.

Expression profiles of selected genes from the microarray data, measured by qPCR. Expression profiles of 13 genes (Table 2) chosen from the microarray data were followed by qPCR. Error bars indicate ± SD for three experiments (biological repeats). The cutoff level of the y-axis was set by the highest signals obtained in no-template controls.
