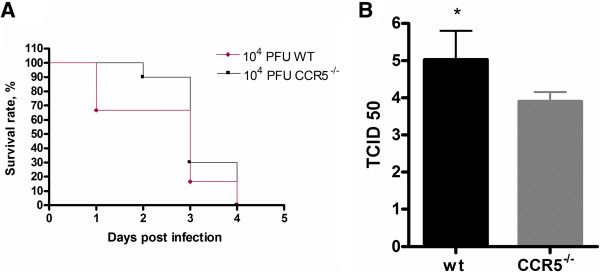
Figure 1.

Course of infection: WT and CCR5-/- mice were intracerebrally inoculated with 104 PFU of virus HSV-1, and (A) survival was assessed daily. (B) Viral load in brain at 1 dpi was assessed in WT (n = 6) and CCR5-/- (n = 10). After sacrifice, brains were collected, macerated, and inoculated into Vero cell cultures to perform the titration procedure in triplicate. Survival curve was created using the product limit method of Kaplan and Meier and survival curves were compared using logrank test. Statistical analysis used to evaluate the viral load was Student’s t-test. Statistically significant results were indicated by ***p < 0.001, **p < 0.01 and *p < 0.05.
