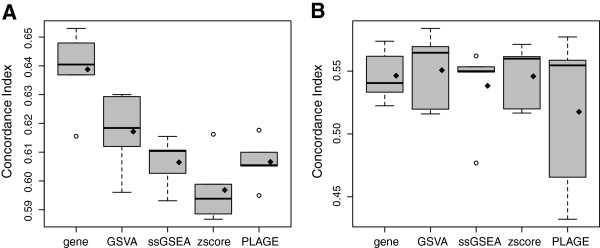
Figure 6.

Survival analysis in a TCGA ovarian cancer data set. Predictive performance in the survival analysis of a TCGA ovarian cancer microarray data set of n=588 samples, measured by the concordance index obtained from a 5-fold cross-validation from (A) the training data and (B) the test data. Diamonds indicate means in boxplots. Except in the training data using the gene-level model, GSVA provides higher mean and median concordance index values than the other compared methods in both training and testing cross-validated data sets.
