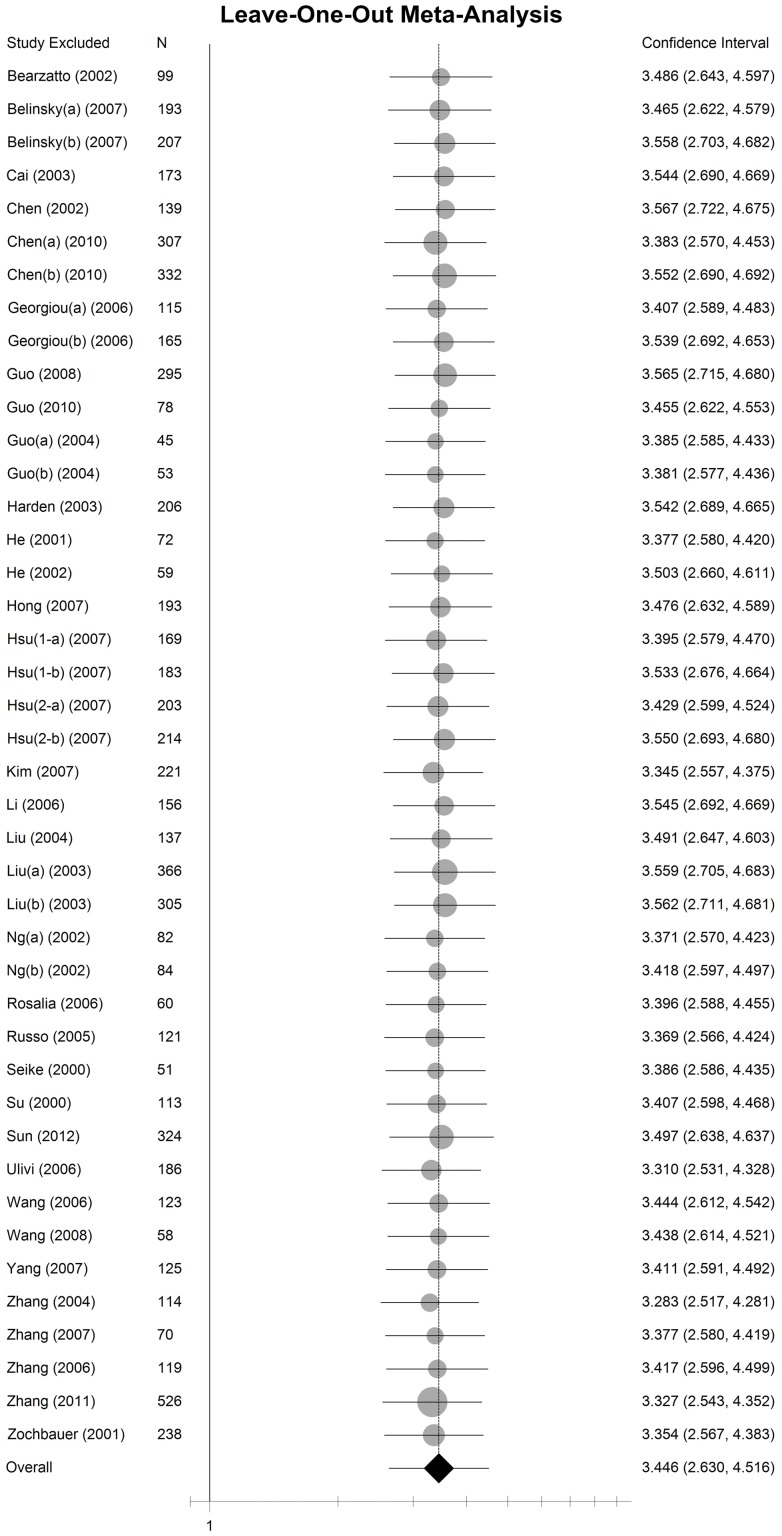
Figure 3. The sensitivity analysis by omitting a single study under the random-effect method.
The circles and horizontal lines represents the pooled OR and 95% CI by omitting a certain study. The area of the circles reflects the weight (by sample size). The diamond represents the pooled OR and 95% CI by including all of studies.

