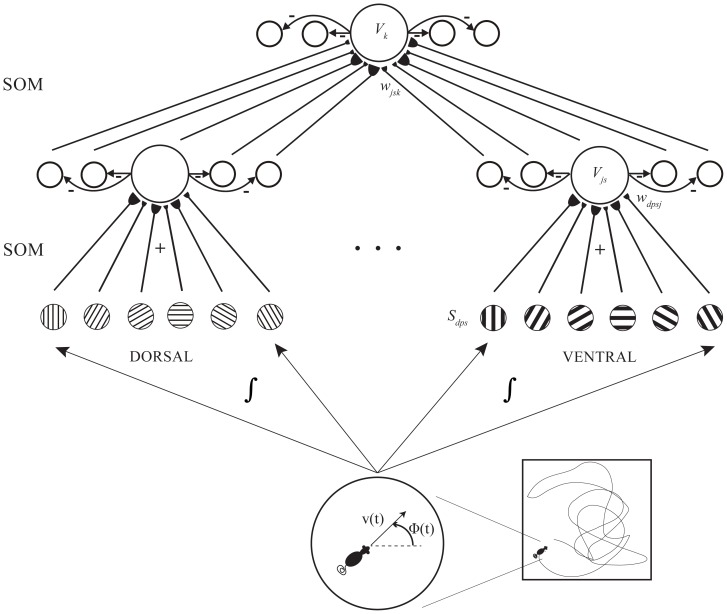
Figure 1. sGridPlaceMap model diagram.
sGridPlaceMap demonstrates the hierarchical self-organization of spiking grid cells of multiple spatial scales and of spiking place cells in response to path integration-based inputs. Model simulations were conducted with 100 hippocampal map cells, three populations comprising 100 map cells each at different locations along the dorsoventral axis of medial entorhinal cortex, and stripe cells with three spacings, 18 direction preferences, and five spatial phases. [Figure reprinted with permission from [29].].

