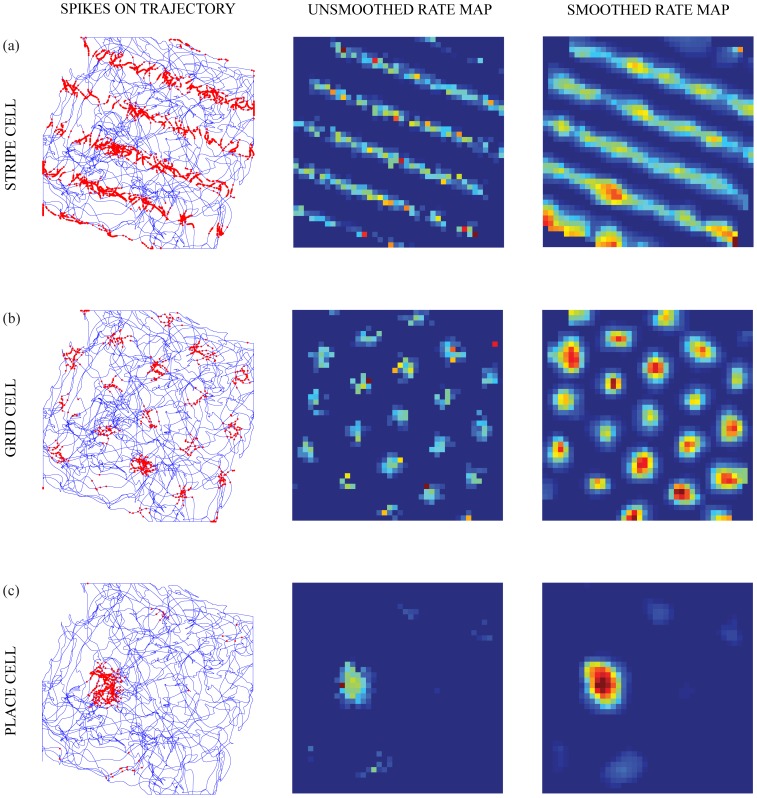
Figure 2. Spiking stripe, grid, and place cells.
Spatial responses of representative (a) stripe, (b) grid, and (c) place cells. The first column shows the spike locations (red dots) of the cells superimposed on the trajectory of the animat during a trial. The second and third columns show the unsmoothed and smoothed spatial rate maps, respectively, of the cells. See Methods section for how spike recordings are converted into rate maps. Color coding from blue (min.) to red (max.) is used for each rate map.

