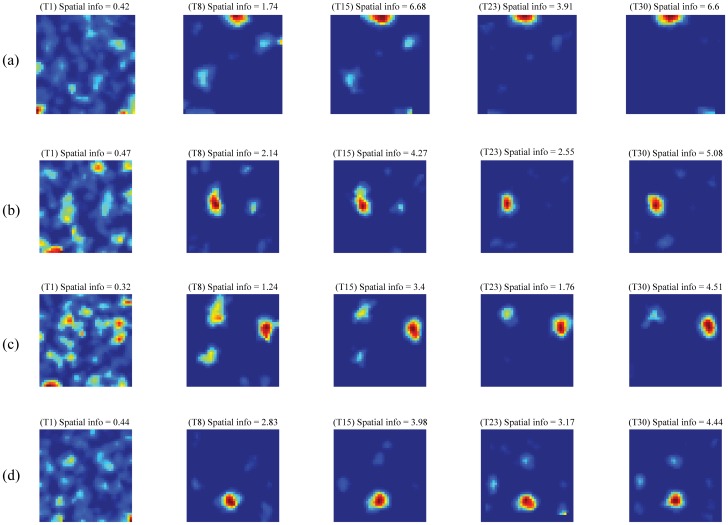
Figure 6. Gradual development of learned place cells.
Evolution of spatial firing fields, evident in the rate map, across learning trials for four representative model place cells (a–d). Note trial number and spatial information on top of each rate map. For example, the values on top of the first rate map of panel (a) correspond to first trial (T1) and spatial information of 0.42. Color coding from blue (min.) to red (max.) is used in each panel.

