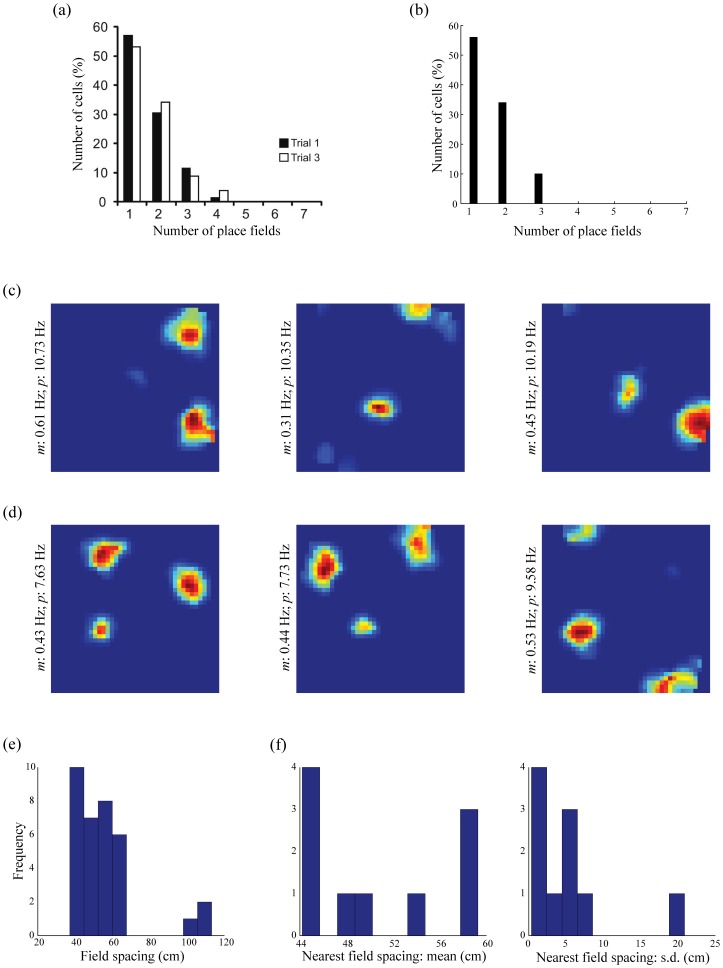
Figure 7. Multimodal firing fields of place cells in large spaces.
(a) Data showing a histogram of the number of place fields, in a circular box with a diameter of 200 cm, for dorsal cells in proximal CA1 [6]. (b) Corresponding model simulations for the number of learned place fields, in a square box of 100 cm×100 cm. (c) Smoothed rate maps in the last trial of three representative model place cells expressing two place fields. (d) Smoothed rate maps in the last trial of three representative model place cells expressing three place fields. Note mean (m) and peak (p) firing rates of the cells along the left side of the corresponding rate maps. (e) Histogram of the field spacing for the model place cells with two place fields. (f) Histograms of the mean and standard deviation of the nearest field spacing for the model place cells with three place fields. [Data reprinted with permission from [6].].

