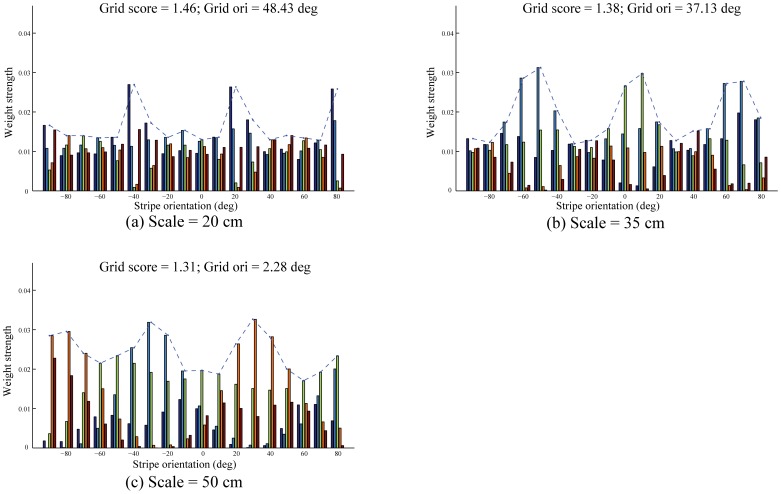
Figure 8. Tuned synaptic weights of learned grid cells.
Distribution of adapted weights from stripe cells, grouped by direction, to the model grid cell with the highest grid score in the last trial for each input stripe spacing: (a) 20 cm, (b) 35 cm, and (c) 50 cm. The different colored bars represent different spatial phases of the stripe cells. The dashed line in each panel traces the maximal weights from the various directional groups of stripe cells. Note corresponding grid score and grid orientation on top of each panel.

