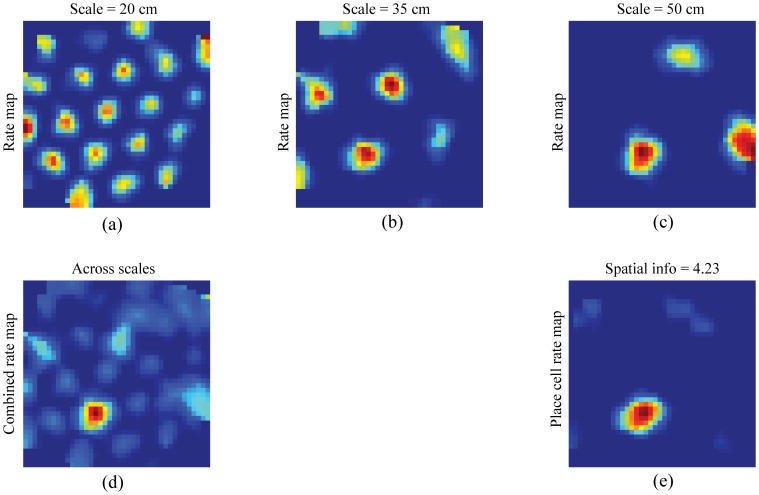
Figure 10. Grid cell bases of a learned unimodal place field.
Smoothed rate maps in the last trial of learned grid cells with maximal weights to a representative learned place cell with a unimodal place field, for each input stripe spacing separately (a–c) and across spatial scales (d), and of the place cell (e). Color coding from blue (min.) to red (max.) is used in each panel.

