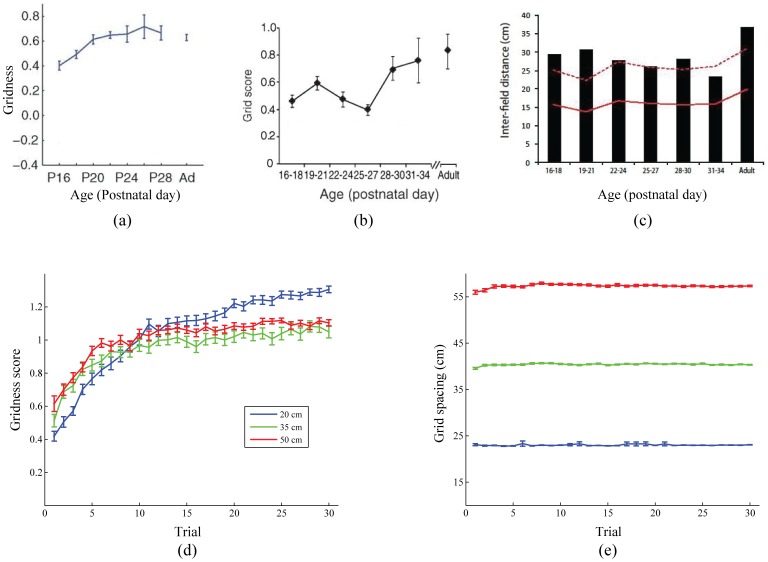
Figure 13. Grid cell development in juvenile rats.
(a–c) Data from juvenile rats and (d,e) model simulations regarding the changes in grid cell properties, namely grid score (a: [35]; b: [34]; d: Model) and grid spacing (c: [34]; e: Model), during the postnatal development period. Panels (d) and (e) show simulation results for each input stripe spacing; see legend in panel (d). The error bars correspond to standard error of mean. [Data reprinted with permission from [34], [35].].

