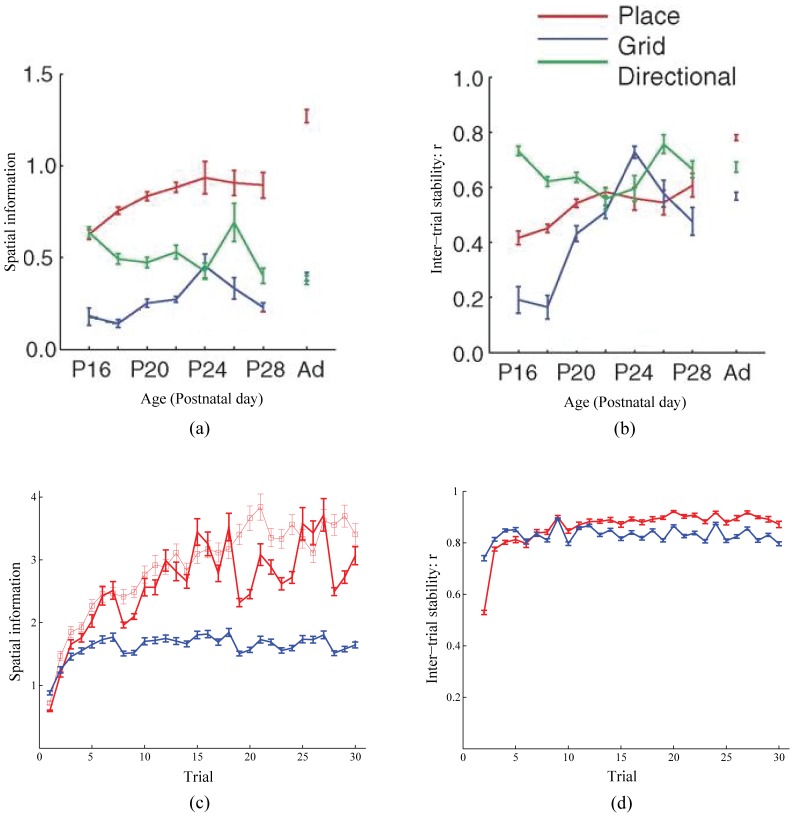
Figure 14. Place cell development in juvenile rats.
(a,b) Data from juvenile rats [35] and (c,d) model simulations regarding the changes in place cell properties, namely (a,c) spatial information and (b,d) inter-trial stability, during the postnatal development period. The legend for all panels is in (b). The two red curves, one with dots and the other with squares, correspond to simulations of place cell spatial information during development in response to spatial experience in a 100 cm×100 cm square box and a 100 cm wide circular box, respectively; see Simulation settings section for how realistic trajectories for the different trials were generated. The panels also show how corresponding grid cell properties change through rat age/experience (a,b) and learning trials (c,d), respectively. The results for model grid cells shown in (c) and (d) are averaged across the three input stripe spacings. The error bars correspond to standard error of mean. [Data reprinted with permission from [35].].

