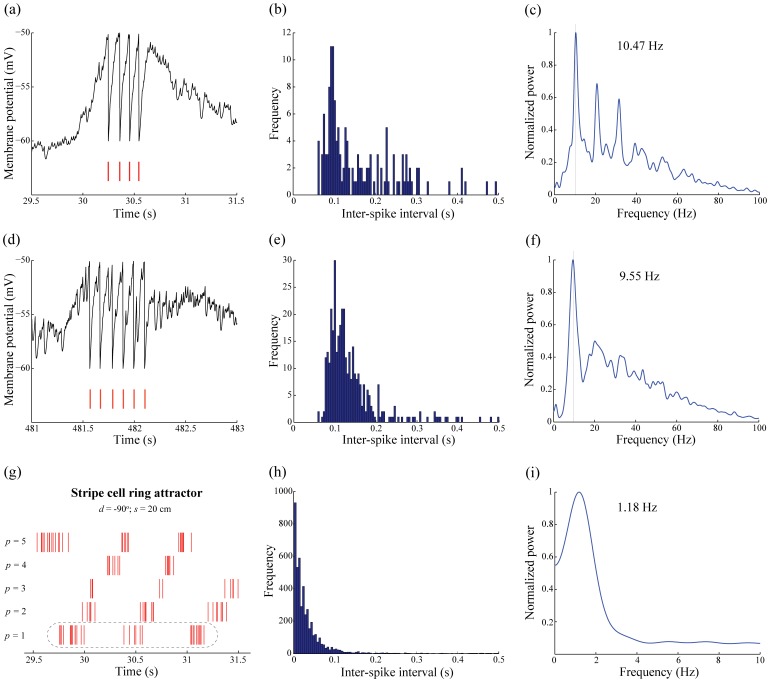
Figure 15. Temporal coding aspects of the various cell types in the model.
Representative results are shown for a learned theta-modulated place cell (a–c), a learned theta-modulated grid cell (d–f), and stripe cells (g–i). (a) Membrane potential dynamics of a model place cell in the last trial over a duration of 2 s, with the spiking events highlighted in red. (b) Histogram of the inter-spike intervals (ISIs) for the cell depicted in (a) over the course of the entire last trial (∼9.98 min). (c) Normalized power spectrum computed from the spike train of the cell depicted in (a) over the course of the entire last trial, whose peak frequency of 10.47 Hz falls within the theta band (4–12 Hz). Along the same lines, panels (d–f) show membrane potential dynamics, ISI histogram, and spike train normalized power spectrum of a model grid cell for the input stripe spacing of 35 cm. (g) Raster plot of spikes from input stripe cells  of different spatial phases belonging to a ring attractor with a spatial scale of 20 cm and a preferred direction of −90°, over a duration of 2 s in the last trial. Panels (h) and (i) show the ISI histogram and normalized power spectrum for the stripe cell highlighted in (g) with a dashed round rectangle.

