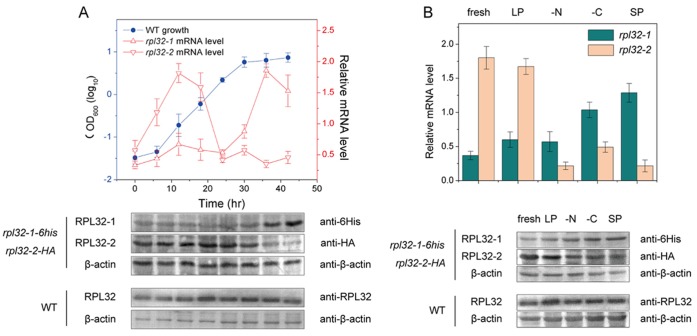
Figure 1. Expression of Rpl32 paralogs varied with different nutrient conditions during cultivation.
(A) The growth curve of WT cells (upper panel), and changes of mRNA level (upper panel) and protein level (lower panel) of Rpl32 paralogs in WT cells during cultivation. (B) mRNA level (upper panel) and protein level (lower panel) of Rpl32 paralogs in WT cells cultured in fresh EMM2, cell-free SP EMM2, cell-free LP EMM2, EMM2-N or EMM2-C medium respectively. QPCR was used for analysis of transcription level standardized with ACT1. Western blot was used for analysis of protein level and β-actin was an internal control.

