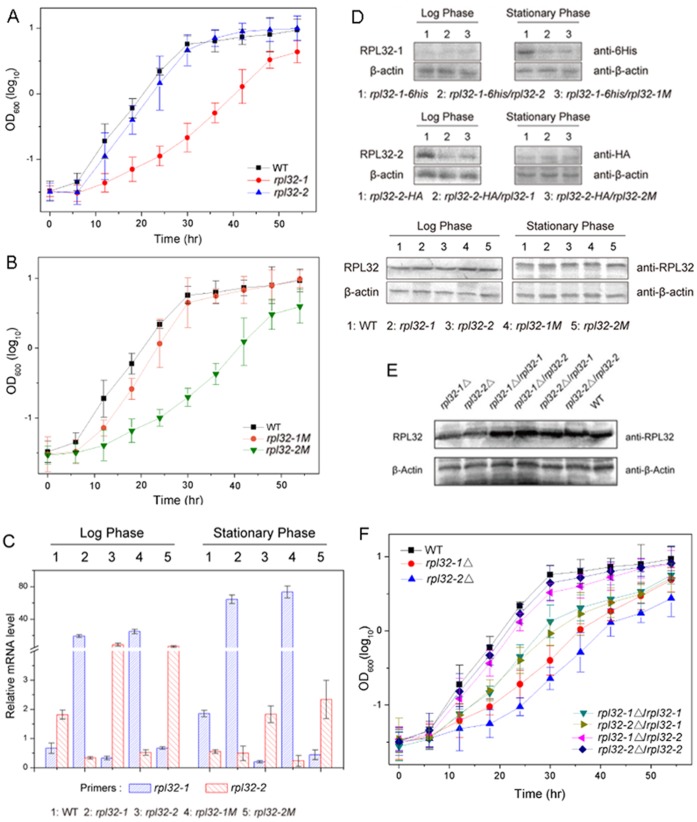
Figure 3. Overexpression or deletion of Rpl32 paralogs affected cell growth and their counterpart expression.
(A) Growth curve of WT, rpl32-1 or rpl32-2 cells. (B) Growth curve of WT, rpl32-1M or rpl32-2M cells. (C) mRNA level of Rpl32 paralogous genes in WT, rpl32-1, rpl32-2, rpl32-1M or rpl32-2M cells in log or early stationary phase, tested by QPCR standardized with ACT1. (D) Protein level of Rpl32-1 in rpl32-1-6his, rpl32-1-6his/rpl32-2 or rpl32-1-6his/rpl32-1M cells, Rpl32-2 in rpl32-2-HA, rpl32-2-HA/rpl32-1 or rpl32-1-6his/rpl32-2M cells, and total Rpl32 in WT, rpl32-1, rpl32-2, rpl32-1M or rpl32-2M cells in log or stationary phase, tested by Western blot. β-actin was used as internal control. (E) Protein level of total Rpl32 in rpl32-1△, rpl32-2△, rpl32-1△/rpl32-1, rpl32-1△/rpl32-2, rpl32-2△/rpl32-1, rpl32-2△/rpl32-2, or WT cells in log phase, tested by Western blot. β-actin was used as internal control. (F) Growth curve of rpl32-1△, rpl32-2△, rpl32-1△/rpl32-1, rpl32-1△/rpl32-2, rpl32-2△/rpl32-1, rpl32-2△/rpl32-2, or WT cells.

