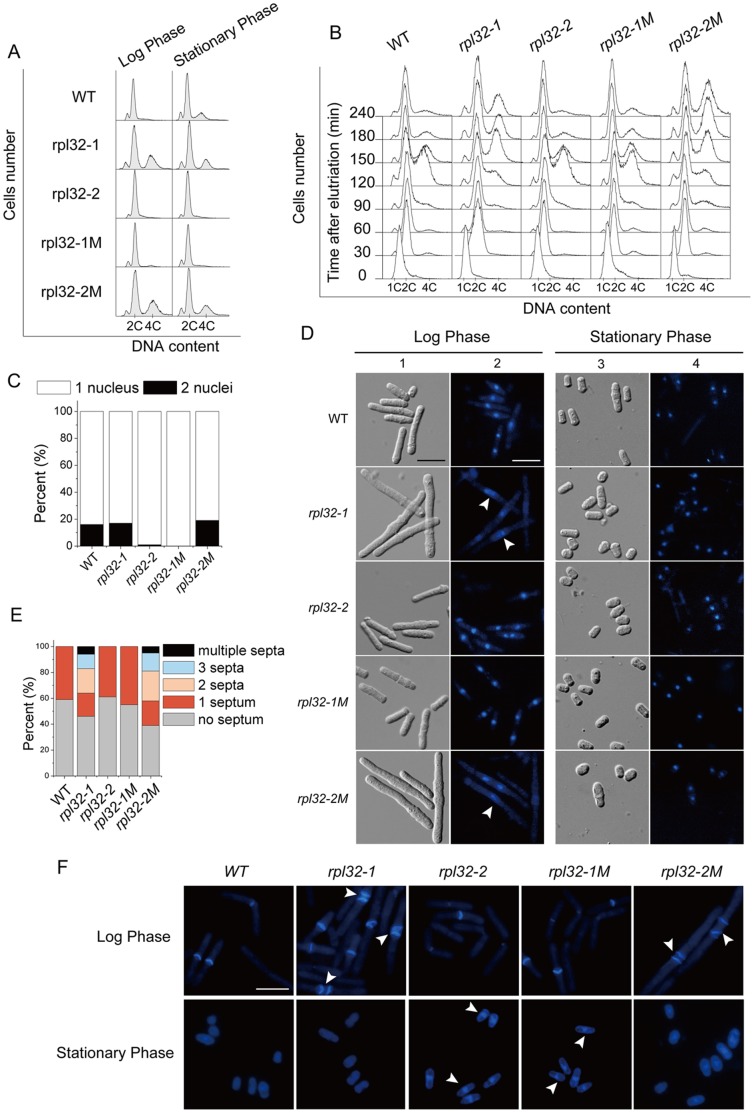
Figure 4. Cellular analysis of cells overexpressing Rpl32 paralogs.
(A) DNA component in rpl32-1, rpl32-2, rpl32-1M, rpl32-2M, or WT cells in log or stationary phase, tested by FACS. 2C indicates the DNA content in a cell containing one G2 nucleus or a mitotic cell containing two G1 nuclei. 4C indicates the DNA content in a cell containing two G2 nuclei. (B) DIC and DAPI images of cells in (A) in log or stationary phase. Arrow indicates defect in nuclei division. scale bar: 10 µm. (C) Nuclei counting of cells from (B) in stationary phase. 300 cells per sample were counted. (D) CW images of septa in cells from (A) in log phase and stationary phase. Arrow indicates multiple septa or septa-like stucture. Scale bar: 10 µm. (E) Quantification of the percentage of septa in cells in (D) in log phase. 300 cells per sample were counted. (F) DNA component in cells synchronized with HU in (A) duiring elutriation, analysed with FACS.

